Every two years the government publishes the National Risk Register, which sets out the most serious risks facing the UK and scores each one for how likely it is and how badly it would affect the country1. The 2025 edition covers 89 risks within 9 risk themes2, and a statement to Parliament in July 2026 referred to ninety-five risks listed in total in the current assessment3. Each risk is placed on a matrix with likelihood on one axis and impact on the other, so a reader can see at a glance which risks planners take most seriously.
The scores are built on "reasonable worst-case scenarios": the worst plausible version of each risk once highly unlikely variations are discounted4. That means a high score is not a prediction that a serious event is coming, and a low score is not a promise it will not. It is a planning tool, and this page explains how to read it as one: what the numbers mean, what worked examples like the pandemic assessment tell you, and what a score can and cannot tell your household about what to keep ready.
How the National Risk Register scores each risk
The National Risk Register is the public-facing version of the National Security Risk Assessment, the government's classified assessment of the national security risks facing the UK or its overseas interests7. The public register summarises all but the most sensitive classified risks3. It sets out the government's assessment of the likelihood and potential impact of a range of risks that may directly affect the UK on a national scale, from severe weather and flooding to terrorism and cyber attacks8.
The scoring itself happens in the classified assessment. Likelihood is scored on a scale from 1 to 5, where a score of 1 represents the lowest likelihood and 5 the highest2. Impact is measured across several dimensions, and each dimension is scored on a scale of 0 to 52. The two scores together place each risk on the risk matrix that appears in the published register.
Two features of the matrix are worth knowing before you read it. First, a number of the most sensitive risks have been thematically grouped, and the position of each grouped risk on the matrix is an average of the impact and likelihood scores of all the risks in that category5. Second, some risks are marked with a number and a letter to represent multiple scenarios of the same risk, for example flooding scenarios labelled 51a, b and c4. So a single dot on the matrix may stand for several distinct scenarios averaged together, and a lettered marker is one scenario among several.
The assessment focuses primarily on domestic impacts, even where the risk occurs internationally5. A risk that begins overseas is scored by what it would do to the UK's safety, security and critical systems at a national level5. The risks are grouped into categories including environmental hazards, human and animal health, major accidents, societal risks, malicious attacks and risks occurring overseas7.
Likelihood: the chance of a risk happening over the assessment period
Likelihood is scored from 1 to 5, and the numbers are anchored to actual probabilities. A score of 1 corresponds to less than a 0.2% chance of the reasonable worst-case scenario occurring at least once in the assessment period2. A score of 5 corresponds to more than a 25% chance5. The 2023 register notes that all risks in the underlying assessment are relatively low likelihood events, which is why the highest score represents a greater than 25% likelihood rather than something higher4.
The steps between scores are not small. The 2025 register states that a score 3 risk is approximately 5 times more likely to occur than a score 2 risk2. A one-point move up the scale is a substantial change in the government's judgement, which is why the register highlights when a score changes: the 2025 edition records that disruption to global oil trade routes moved from a likelihood score of 2 to a 3, and a conventional attack on infrastructure moved from 4 to 32.
Local registers use the same 1 to 5 scale, and London's register attaches percentage bands to each score over a 12-month period: score 2, Medium Low, is between 0.2% and 1%; score 3, Medium, is between 1% and 5%; score 4, Medium High, is between 5% and 25%; and score 5, High, is more than 25% probability of the reasonable worst-case scenario occurring within 12 months9. Note that London's bands are measured over 12 months, while the national assessment works over a longer period, so the same percentage means something different at each level.
For malicious risks, where different intelligence language is used, the register maps the professional judgement of analysts onto the same scale, with designations ranging from almost certain (95 to 100%) down through highly likely (80 to 90%), likely or probable (55 to 75%), realistic probability (40 to 50%) and unlikely (25 to 35%)5.
Impact: how badly a risk would affect the country
Impact is not a single number. The assessment scores several dimensions of harm, each on a scale of 0 to 52. The published scales give a sense of what the numbers correspond to in human terms. On the fatalities dimension, score 1 means 1 to 8 deaths, score 2 means 9 to 40, score 3 means 41 to 200, score 4 means 201 to 1,000, and score 5 means more than 1,000 fatalities4. On casualties, score 1 means 1 to 18 casualties, score 2 means 17 to 80, score 3 means 81 to 400, score 4 means 400 to 2,000, and score 5 means more than 2,0004.
| Impact score | Fatalities | Casualties |
|---|---|---|
| 1 | 1 to 8 | 1 to 18 |
| 2 | 9 to 40 | 17 to 80 |
| 3 | 41 to 200 | 81 to 400 |
| 4 | 201 to 1,000 | 400 to 2,000 |
| 5 | more than 1,000 | more than 2,000 |
The dimensions go beyond deaths and injuries. The National Audit Office, reviewing food supply resilience, describes a set of risks including a national power outage, pandemic, nuclear accident, or large-scale chemical, biological, radiological or nuclear attack, considered low likelihood but in the highest impact category10. Recovery time is part of the picture too: the 2025 register notes that recovery from a serious incident can last months, years or even decades2.
The register also looks at who would be affected unevenly. Qualitative data is collected on the disproportionate impacts of reasonable worst-case scenarios on vulnerable individuals and groups, in accordance with the Public Sector Equality Duty4. For your household this matters: a risk scored "moderate" for the country as a whole may be severe for the people least able to cope with it, and the register's own assessment recognises that.
Pandemic: a worked example of a 5 to 25% likelihood
Pandemic influenza is the clearest example of how the scoring works in practice, and it is the risk most households ask about. The National Risk Register 2025 assessed that the likelihood of a pandemic occurring in the next 5 years is 5 to 25%, and that the impact would be at the highest level on the register's scale6. On the 1 to 5 scale that is a likelihood of 4 and an impact of 5, which is how the London Risk Register records it, based on the UK Health Security Agency's December 2024 assessment9.
Local registers carry the same picture. Wiltshire and Swindon's preparedness site rates pandemic influenza as likelihood 4 and impact 5, with the impact described as the top rating (5) and likelihood as Medium High (4), and notes it is rated Very High on their Community Risk Register and has been the top risk for some time11. The London register's scenario includes a case fatality ratio of 2.5%9.
Two planning details sit behind the score. The government anticipated that it would take at least four to six months after a pandemic begins before a vaccine becomes available7. And the 2025 register states that it has been a planning assumption that a plan for pandemic influenza would have considerable overlap with a plan for other diseases easily transmitted by the respiratory route2. The 2023 register adds that the reasonable worst-case scenario for pandemic planning, previously based on an influenza-like illness pandemic, has been reshaped into a more generic pandemic scenario reflecting a broader range of possible manifestations4.
For a household, the practical reading is this: a likelihood of 4 out of 5 over five years is one of the highest scores on the register, and the impact is at the top of the scale. That combination is why pandemic planning appears in national and local advice, and why keeping some resilience against disruption to normal life, such as food and medicine supplies, is reasonable rather than alarmist.
Reading the risk matrix: likelihood against impact
The matrix plots each risk by likelihood against impact. The basic idea is captured in the formula one local flood risk strategy uses: risk equals the probability of an occurrence multiplied by its potential consequence12. A risk that is very likely but minor, and a risk that is very unlikely but severe, both demand attention, but of different kinds.
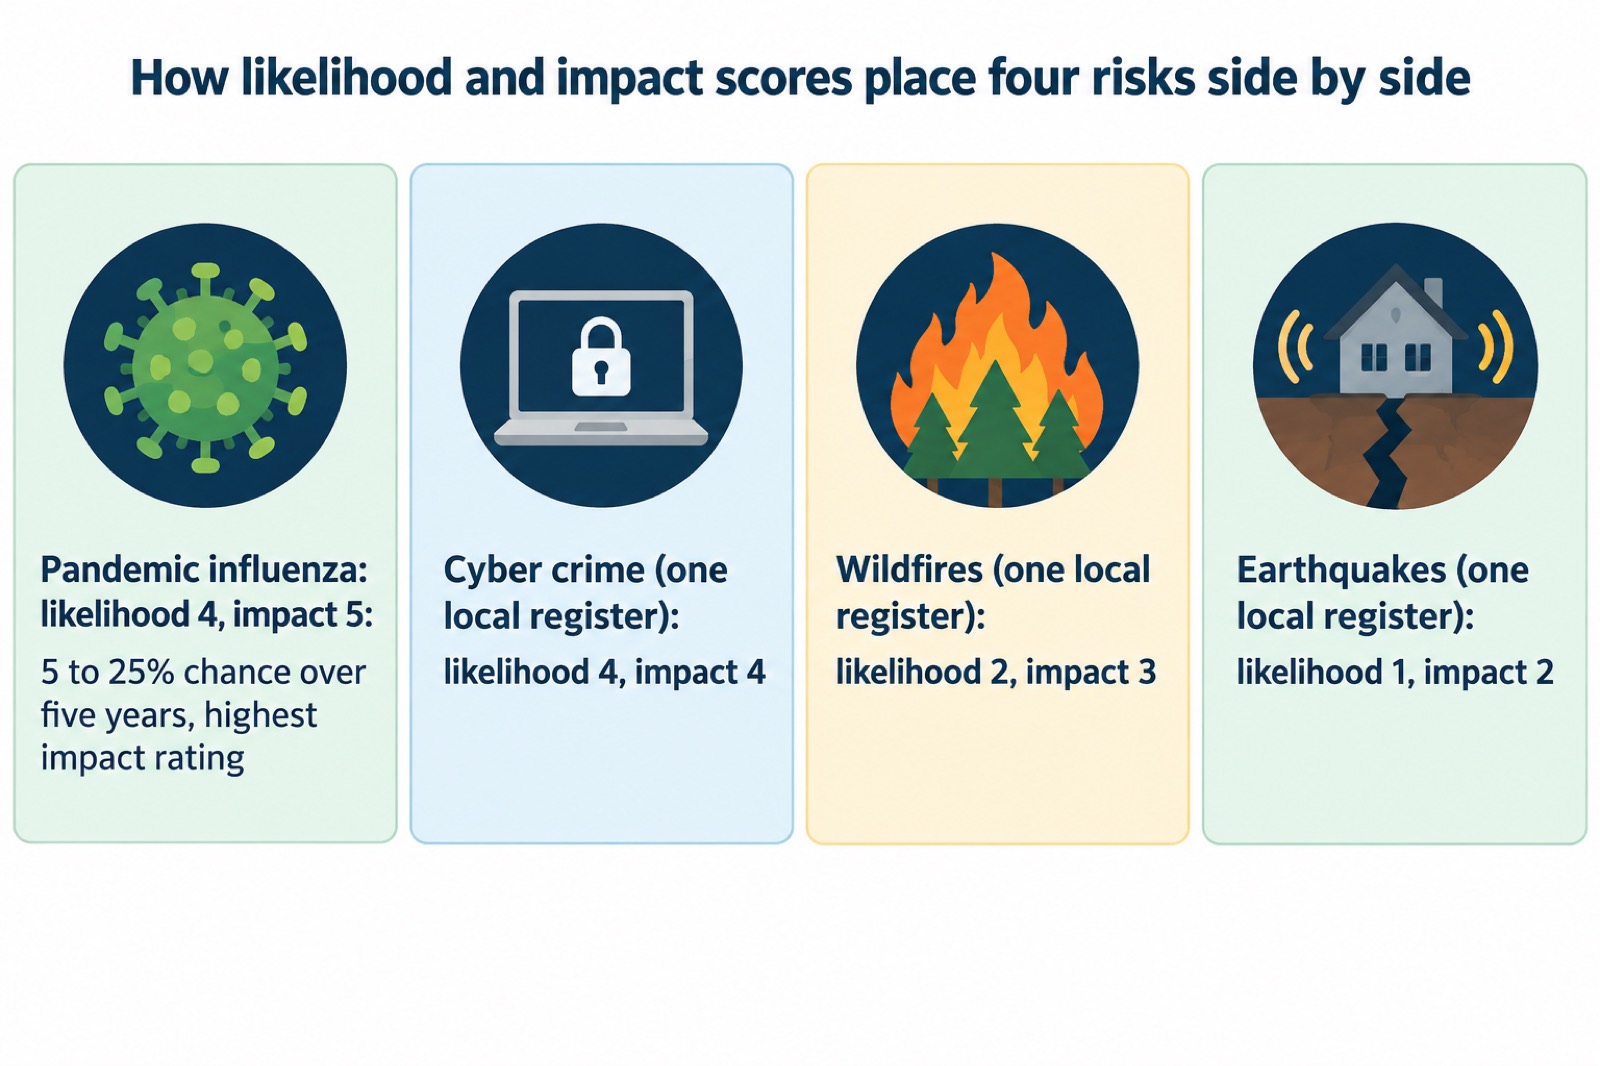
Local risk registers show the same scoring in action. Wiltshire and Swindon's site gives wildfires a likelihood/impact rating of 2/314, earthquakes 1/215, and cyber crime 4/413. Read together, those numbers say: cyber crime is much more likely than an earthquake and would hurt more when it happens, so it deserves more of your household's attention, while an earthquake in most of the UK is a low priority for personal preparation.
The overall ratings that local registers attach to these scores follow a consistent pattern. Surrey's Community Risk Register classes Very High risks as primary or critical risks requiring immediate attention16, and Low risks as both unlikely to occur and not significant in their impact16. London's register adds that Very High risks should have strategies developed to reduce or eliminate them, with mitigation in the form of multi-agency planning, exercising and training, monitored on a regular frequency, and that Low risks are managed using normal or generic planning arrangements and require minimal monitoring and control9.
What "reasonable worst-case scenario" actually means
Every score on the register is attached to a reasonable worst-case scenario: the worst plausible manifestation of that particular risk, once highly unlikely variations have been discounted5. This is the single most misunderstood part of the system, and it works in both directions.
It does not mean the government expects the worst. Carmarthenshire's council puts it plainly: the inclusion of hazards or scenarios does not mean that the Local Resilience Forum believes the risk will materialise, or that if it were to do so, it would be at that scale; the risk scenarios are reasonable worst-case assumptions upon which the risk assessment is based17. An actual pandemic, flood or power cut may well be milder than the scenario the scores describe.
It also does not mean the worst possible outcome. Highly unlikely variations are deliberately discounted5. A scenario is chosen that is bad but plausible, so that plans are stretched to cover a serious version of the risk without being built around versions so extreme they distort planning.
The reason for this approach is consistency. If every responder planned against a different assumption about how bad a flood or an outbreak could be, their plans would not fit together. Scoring every risk against its reasonable worst-case scenario gives national government, local resilience forums and individual responders a shared basis for what they are preparing for.
What a score tells your household to prepare for
A risk score is written for planners, but it translates into household actions. The highest-likelihood, highest-impact risks on the national and local registers point to the disruptions most worth being ready for, from power cuts and flooding to storms and snow, infectious disease and cyber attacks. West Yorkshire Prepared advises households to consider the kinds of risks that might affect where they live, with more information in the Community Risk Register8.
Start with your local register. West Yorkshire Prepared advises households to consider the kinds of risks that might affect where they live, with more information in the Community Risk Register18. Gloucestershire's register is typical of what they offer: it informs you about the highest risks in the county and their consequences, details steps to become better prepared and more resilient, and provides links to organisations and websites to find out more19. Argyll and Bute Council notes that each area has a duty to publish a Community Risk Register showing what risks have been identified in your area and their potential impact20.
Then match your preparations to the scores you find:
- High likelihood, any impact: these are the risks most likely to disrupt your household first. Keep the basics ready: emergency kit, water, lighting and a way to stay informed.
- High impact, lower likelihood: these justify a modest, cheap level of readiness rather than daily thought. A pandemic score of 4/5 is the reason a small extra food store and a plan for looking after vulnerable relatives makes sense.
- Risks specific to where you live: coastal flooding, major industrial sites, or wildfire-prone heathland change what your plan should include. Consider the kinds of risks that might affect where you live, with more information in your area's Community Risk Register.
- Risks to your home itself: the London Fire Brigade's Home Fire Safety Checker asks a series of questions to work out the level of risk in your home, or the home of someone you care for21. Fire is a risk you can score yourself.
Some warning systems use the same likelihood-and-impact logic at a household level. The UK Health Security Agency's cold health alert risk score is a number between 1 and 16, determined based on the potential impact level of the low temperatures and the likelihood of those impacts occurring, ranging from very low impact and very low likelihood up to high impact and high likelihood22. Once you understand the national scale, the same idea appears wherever risk is communicated.
Where a score stops being useful
Scores have limits, and reading them without those limits leads to both over-reaction and under-reaction.
First, the register only covers acute risks: discrete events requiring an emergency response4. Chronic risks, the slower pressures that build over time, are not included; they were last included in the National Risk Register in 20202. A problem that never arrives as a single event will not appear on the matrix, however much it affects your household.
Second, the public register is a summary of a classified assessment. The published version includes a summary of all but the most sensitive, classified risks3, and some detail is grouped or averaged5. In Wales, the equivalent information is held in a classified Wales Risk Register23. You are reading the public face of a fuller picture.
Third, scores move, and entries can disappear. The 2025 edition records that a malicious drone incident matrix entry was removed from that version2, and shows likelihood scores changing in both directions2. A score is a snapshot of current judgement, not a permanent property of the risk.
Fourth, local registers mainly talk about relatively high-level threats, as Argyll and Bute Council notes, so use local knowledge to identify other local risks not included20. A blocked culvert, a steep ungritted lane or an unreliable local power line may matter more to your household than anything on the register. The scores tell you what planners are preparing for; they do not exhaust what you should think about.
Finally, remember what the numbers are not. They are not predictions24, and a low score is not a guarantee. Earthquakes score 1/2 in at least one local register15, and earthquakes in the UK do happen. Low scores mean minimal monitoring and generic planning9, not that a risk is impossible.
Where to find the National Risk Register and local risk information
The National Risk Register is published on the government's website, with the 2025 edition following the previous edition published in August 20232. A further version was published in July 2026, including a summary of all but the most sensitive classified risks3. The government's national emergencies guidance explains the likelihood of a risk occurring and the possible effects of an emergency if it happens25. Our page on the National Risk Register walks through the current edition in detail.
For your own area, the document to find is the Community Risk Register. Each Local Resilience Forum publishes one, setting out the different risks most likely to cause disruption in your region26. Local resilience forums are responsible for conducting Community Risk Assessments and developing the register, which identifies potential risks and hazards such as floods, industrial accidents and pandemics that could impact the local area27. The register is based on a combination of the UK Government's National Risk Register, professional judgement, historical evidence, scientific input and expert analysis19, and the national register itself should be read in conjunction with your local one5.
Where you look depends on where you live:
| Nation | Where to find your local register |
|---|---|
| England | Your Local Resilience Forum's Community Risk Register, via the national "check the risks where you are" pages26 |
| Scotland | Community Risk Registers for Scotland can be found on the Scottish Fire and Rescue Service website26 |
| Wales | Local registers, for example the North Wales Community Risk Register, plus a classified Wales Risk Register held centrally28 |
| Northern Ireland | Check your council's emergency planning pages, which signpost the local risk arrangements |
Local registers vary in how current they are. Lancashire's forum describes how the register sets out the risks present in the community and assesses how likely they are to lead to an emergency and the potential impact, and monitors the risks at each of its meetings to check it is still relevant and there are no newly emerging issues29. London publishes an annual update in the spring, with all risks rated Very High or High reviewed yearly and other risks reviewed every two years9. Greater Manchester has an updated accessible version of its Community Risk Register due in Autumn 20261.
One consistent feature: the risk assessments in community registers normally cover only non-malicious events, that is hazards, rather than threats such as terrorist incidents24. Surrey's register states the same scope, displaying risk assessments for non-malicious events rather than those caused deliberately16. Malicious threats are assessed nationally instead, so read the two registers together for the full picture.
How often the scores change
The National Risk Register is published every two years1. Behind the published document, the classified assessment is now more dynamic: the National Security Risk Assessment operates on a dynamic model, updated in regular cycles several times a year, with risks reassessed as often as necessary24.
That rhythm matters for how you use the register. A score you read today reflects a judgement that may already have been revised internally, and the next published edition can move risks up, down or off the matrix entirely2. Treat the register as a periodically refreshed snapshot, and check your local register's own review cycle when you read it9.
Chronic risks: what the matrix leaves out
The distinction between acute and chronic risks is worth understanding, because it explains a real gap in what the register can tell you. The register focuses on acute risks, which are discrete events requiring an emergency response4. Chronic risks, the slow-building pressures, were last included in the National Risk Register in 2020 and are not in the current edition2.
The practical consequence for your household is that the absence of a risk from the matrix is not evidence it does not matter. A gradual trend that never produces a single emergency event will not be scored, however much it erodes resilience over time. The register answers the question "which sudden events should we plan for?" and does not attempt to answer "which slow problems should we adapt to?" Both questions matter; only one of them has a published matrix.
Sources (29)
- Our risks and plans, Greater Manchester Combined Authority, 2026
- National Risk Register 2025, Cabinet Office / HM Government, 2025
- National Resilience Annual Statement, Hansard, 2026
- 2023 National Risk Register, HM Government, 2023
- National Risk Register annex, City of York Council, 2023
- Emergency planning and business resilience, Northumberland County Council, 2025
- National Risk Register: Preparing for National Emergencies, House of Lords Library, 2022
- Pandemic and infectious disease preparation, Greater Manchester Combined Authority, 2026
- London Risk Register v14 public version, Greater London Authority, 2025
- Resilience of the food supply chain to disruptions, National Audit Office, 2026
- Pandemic risk in Wiltshire and Swindon, Wiltshire and Swindon Prepared, 2024
- Suffolk Local Flood Risk Management Strategy, Suffolk County Council, 2023
- Cyber crime risk page, Wiltshire and Swindon Prepared, 2024
- Wildfires risk page, Wiltshire and Swindon Prepared, 2026
- Earthquakes risk page, Wiltshire and Swindon Prepared, 2024
- Surrey Community Risk Register 2026, Surrey County Council, 2026
- Get Prepared - Carmarthenshire County Council, Carmarthenshire County Council
- Advice for households, West Yorkshire Prepared, 2026
- Community Risk Register, Gloucestershire County Council, 2026
- Making your plan, Argyll and Bute Council, 2026
- Protect: home fire safety, London Fire Brigade, 2026
- Cold health alert risk score, UK Health Security Agency, 2025
- Resilience: risks in Wales, Welsh Government, 2026
- The UK Government Resilience Action Plan, HM Government, 2025
- National emergencies, GOV.UK, 2026
- Check the risks where you are, Prepare campaign, HM Government, 2026
- What is a Local Resilience Forum?, Essex Prepared, 2026
- Civil emergencies and emergency plan, Isle of Anglesey County Council, 2026
- Risks in Lancashire, Lancashire County Council, 2026
 30-Day Household Checklist
 Emergency Plan Template
 Supply Interruption Checklist
 National Risk Register
 Civil Contingencies Act 2004
 What Counts as an Emergency
 Category 1 and 2 Responders
 Local Resilience Forums
 Strengthening Local Resilience
 What Your Council Does
 Central Government Response
 Gold, Silver and Bronze Command
 Major Incident Declared
 Emergency Powers
 Warning and Informing the Public